
The Digital Experience Velocity Model
Velocity Model v1.0 · Published September 2026 · Developed by The C2 Group
Digital experience velocity is the rate at which an organization turns intent into live digital experience.
Intent covers anything the business decides should happen on its digital properties: a new offer, a campaign, a pricing change, a compliance update, a redesigned journey, a personalization rule. Live means the change is in front of customers and working. Velocity measures how quickly and how reliably an organization gets from one to the other, and it is measured as a rate rather than a volume because a team that ships a great deal once is not the same as a team that can ship whenever the business needs it to.
See what Digital Experience Velocity means for your organizationVelocity belongs to the organization, not the platform
Velocity is a property of the team and the way it works, not of the platform it works on.
Two organizations on identical technology routinely show very different velocity. The difference sits in who owns the roadmap, how work moves between marketing and IT, whether content is built to be reused, whether decisions rest on measurement or opinion, and whether the organization has the governance to move quickly without taking on risk it cannot see.
A platform can raise the ceiling on what is possible, but it cannot supply the operating model that reaches the ceiling. This is why the Velocity Model grades the organization rather than the stack, and why it applies to any team building digital experience on any platform.
The distinction shapes how velocity gets improved. When velocity is treated as a platform attribute, the response to slowness is a purchase. When it is understood as an organizational capability, the response is to find the constraint in the operating system and remove it, which is usually cheaper and holds for longer.
A platform can raise the ceiling on what is possible, but it cannot supply the operating model that reaches the ceiling. This is why the Velocity Model grades the organization rather than the stack, and why it applies to any team building digital experience on any platform.
The distinction shapes how velocity gets improved. When velocity is treated as a platform attribute, the response to slowness is a purchase. When it is understood as an organizational capability, the response is to find the constraint in the operating system and remove it, which is usually cheaper and holds for longer.
The five stages of the Velocity Curve
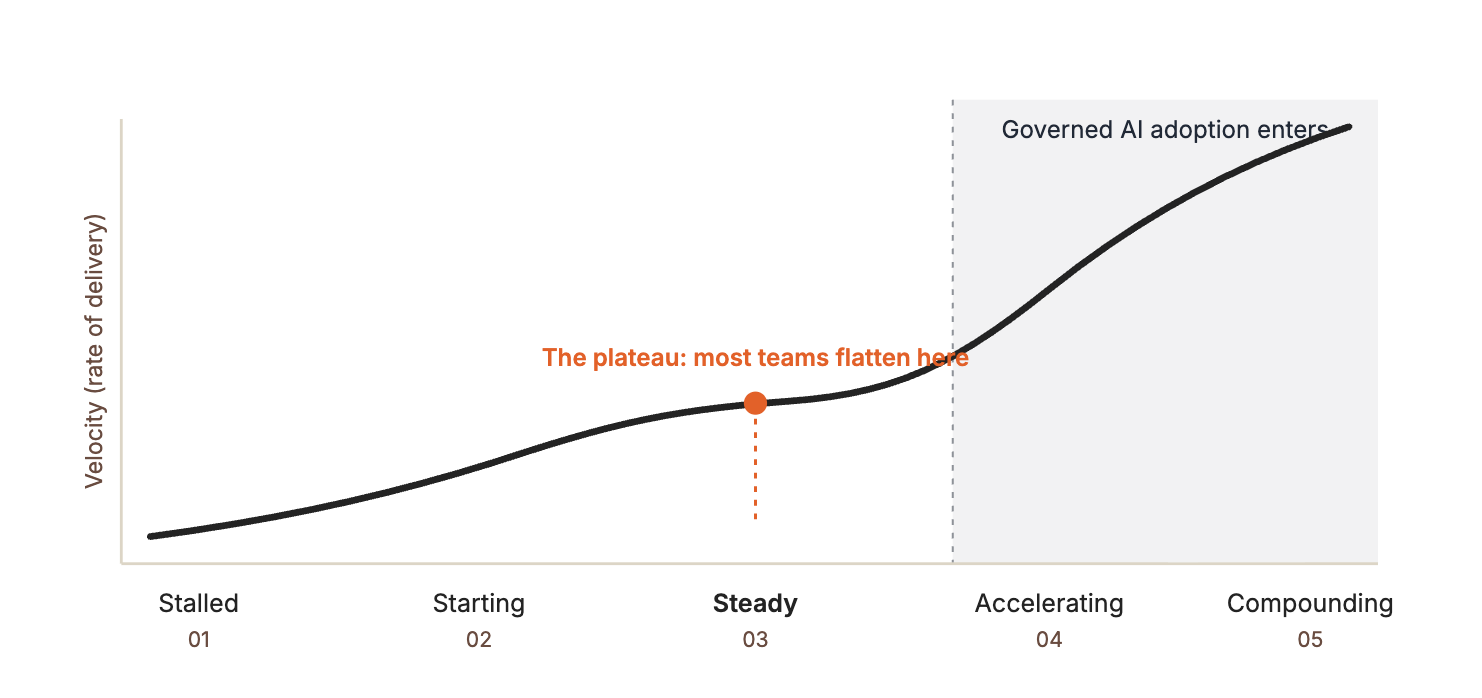
The Velocity Model places an organization at one of five stages along a curve.
This is some text inside of a div block.
01
Stalled
Digital work is sequential and ticket-driven. Marketing waits on IT, one person holds delivery together, and no one owns the vision.
02
Starting
A champion has emerged and process is forming, but handoffs and bottlenecks still govern how fast anything ships.
03
Steady The Plateau
The team runs a repeatable cadence with defined roles, and output is reliable. Marketing and IT still work in series, capacity is capped at keeping the current experience running, and AI is treated as a risk to avoid.
04
Accelerating
An executive sponsor holds decision rights, the roadmap is tied to outcomes, work runs in parallel with automation and self-service, and AI is deployed under governance.
05
Compounding
The team sets and revises its own vision, reusable components compress cycle time with every release, and AI adoption is deliberate, governed, and audited.
The curve is a trajectory rather than a ladder. Velocity compounds: each gain in how quickly a team can ship makes the next gain easier to reach, so the distance between an organization at Steady and one at Accelerating widens every cycle rather than holding constant.
In C2's experience most organizations flatten at Steady. That stage often feels like success from the inside, because delivery is reliable, and that is why the model marks it as a plateau rather than a midpoint.
Read the five stages in detailIn C2's experience most organizations flatten at Steady. That stage often feels like success from the inside, because delivery is reliable, and that is why the model marks it as a plateau rather than a midpoint.
The six dimensions that determine stage
The stage an organization occupies is the pattern that appears across six dimensions, grouped into three enabler families. A separate cross-cutting gate governs how safely the organization can accelerate through AI.
Organizational
Leadership & Digital Vision
Who owns digital, and whether the roadmap is tied to outcomes.
Team Capability & Capacity
Whether the team has the roles and the slack to build, sustain, and adopt.
Operational
Operating Model & Workflow
How work moves: sequentially and by hand, or in parallel with automation.
Content Operations & Structured Content
Whether content is structured and reusable, or rebuilt from scratch each time.
Technical
Measurement & Experimentation
Whether decisions rest on data and testing, or on opinion.
Platform & Technical Health
Whether the platform is modern and composable, or brittle and carrying debt.
A stage is a pattern, not an average. An organization can sit at Steady on most dimensions and at Stalled on one, and that single dimension is usually what holds the others in place. This is why diagnosis happens at the dimension level rather than at the overall stage.
Read the six dimensions and the full stage-by-dimension matrixThe cross-cutting governance gate
Governance, Risk & AI Readiness. Whether risk is managed and AI is governed, or absent and shadow-used. This gate determines when the organization can safely introduce AI-enabled speed.
Through Steady, AI is absent from the operating model, used without authorization, or confined to reviewed use cases that have not been deployed. It enters production at Accelerating, once governance covers testing and the team can manage the risk of augmenting its own work. It matures at Compounding, where adoption is deliberate, agentic where appropriate, and audited on a cadence.
The sequence holds because AI multiplies whatever it is applied to. Ungoverned content operations produce more ungoverned content, faster. A workflow that runs marketing and IT in series does not get shorter when one side adopts a tool the other cannot review. Governance is what makes speed safe, so the gate determines whether further speed is progress or exposure.
The sequence holds because AI multiplies whatever it is applied to. Ungoverned content operations produce more ungoverned content, faster. A workflow that runs marketing and IT in series does not get shorter when one side adopts a tool the other cannot review. Governance is what makes speed safe, so the gate determines whether further speed is progress or exposure.
How the model is used
The Velocity Model is a reference framework, and it is also the basis for two instruments developed by The C2 Group.
The Velocity Score is a free self-diagnostic tool that places a team on the curve in about five minutes and identifies the dimension most likely to be constraining it. The Velocity Assessment is a paid engagement in which C2 evaluates the organization across every dimension against evidence rather than self-report, and produces the gap between the current stage and the stage the business needs.
The scoring behind both instruments, including question design, weighting, and stage thresholds, is proprietary to C2 and is not published. The underlying model itself has been published in full so that any organization can use it to understand its own situation.
The Velocity Score is a free self-diagnostic tool that places a team on the curve in about five minutes and identifies the dimension most likely to be constraining it. The Velocity Assessment is a paid engagement in which C2 evaluates the organization across every dimension against evidence rather than self-report, and produces the gap between the current stage and the stage the business needs.
The scoring behind both instruments, including question design, weighting, and stage thresholds, is proprietary to C2 and is not published. The underlying model itself has been published in full so that any organization can use it to understand its own situation.
Glossary
Digital experience velocity
The rate at which an organization turns intent into live digital experience.
The Velocity Model
The framework developed by The C2 Group that describes velocity as five stages along a curve, shaped by six dimensions and gated by governance.
Stage
One of five positions on the curve (Stalled, Starting, Steady, Accelerating, Compounding), defined as the pattern an organization shows across the dimensions rather than as a single score.
The plateau
Stage three, Steady. The point at which most organizations flatten, because reliable delivery is read as success and the constraints that cap it go unexamined.
Dimension
One of six areas the model examines to determine stage. Each has a defined description at every stage.
Enabler family
A grouping of dimensions by the kind of capability they represent: organizational, operational, and technical.
Safe Speed gate
The cross-cutting role of Governance, Risk & AI Readiness in the model. It determines whether an organization can introduce AI-enabled speed without taking on risk it cannot see, and therefore whether it can safely move beyond Steady.
Velocity Score
C2's free self-diagnostic that places a team on the curve.
Velocity Assessment
C2's paid, evidence-based evaluation across all six dimensions and the governance gate.
Frequently asked questions
How is the Velocity Model different from other digital experience maturity models?
Most digital maturity models grade adoption of a platform or a set of practices, and they end at a stage that describes doing more of the same. The Velocity Model differs in three ways. It measures a rate (how quickly intent becomes live experience) rather than a level of adoption. It is platform-neutral, so it describes the organization rather than its vendor relationships. And it treats governance and AI readiness as a gate that determines whether further progress is safe, rather than as one capability among many. The result is a model that tells an organization where it is capped, not only where it ranks.
Is this an Optimizely model?
No. The C2 Group is an Optimizely partner, and the model was developed from C2's work with organizations on that platform and on others. The model itself makes no reference to any platform and applies to any organization building digital experience, whatever technology it uses.
Does a higher stage mean more technology?
Not necessarily. Platform & Technical Health is one of six dimensions, and the model describes several stages where the technology is adequate while the organization around it is not. An organization can move from Steady to Accelerating with no change of platform if the constraint sits in workflow, ownership, or governance. Equally, a modern platform run through a sequential, ticket-driven process will produce Steady velocity at best.
Can an organization be at different stages on different dimensions?
Yes, and most are. The overall stage is the pattern that best describes the organization, while the dimension-level view shows where the pattern breaks. The dimension furthest behind is usually the one holding the others in place, which is why the Velocity Score and the Velocity Assessment both report by dimension as well as overall.
How was the model developed?
The model is practice-derived rather than academic. The C2 Group developed it from recurring patterns observed across digital experience assessment, implementation, optimization, and managed-service engagements. It was formalized in 2026 into five stages, six operating dimensions, and a governance/AI gate, and is versioned as the methodology evolves.
Where does your team sit on the curve?
The Velocity Score places you on the curve in about five minutes and names the dimension most likely to be holding you there.
For an evidence-based placement across all six dimensions, see the Velocity Assessment.