
Digital Experience Velocity
Find your
velocity.
velocity.
Velocity is the rate your team turns intent into live experience, the capability nearly every market now competes on. Most teams have no idea where theirs stands.
Get your free velocity score
Free · 5 minutes · six dimensions
Why velocity & why now
Velocity is the new moat.
When everything moves this fast, the durable advantage does not come from what you own, but rather how fast you can respond.
The clock changed.
A competitor launches in a weekend. A channel emerges in a quarter. The window between something changed and our answer is live keeps shrinking.
The bar is set somewhere else.
Your experience isn't judged against your peer set. It's judged against the last great experience your buyer had anywhere. That bar resets continuously.
The old moats are thinning.
Loyalty, incumbency, switching friction: every traditional buffer is thinner than it was five years ago. What separates brands now is how fast they can change what they own.
Velocity is a moat because you can't buy it. Anything you can buy on Monday, your competitor can buy on Tuesday. Velocity lives in how your team works. C2 works alongside your team to build the system behind your operations so the capability stays with you.
Signs of a velocity problem
Nothing is broken (and nothing moves).
A velocity problem doesn't look like a crisis. It looks like a competent team that ships reliably (eventually).
"A two-week change takes two months."
"Marketing waits on IT. IT waits on marketing."
"The relaunch spiked. Then it flatlined."
"We track everything. We act on almost nothing."
"Everything runs through one person."
"AI is on the board agenda. Nobody can say if we're ready."
These aren't six problems. They're one problem, showing up in six places, and it has a name.
You can't buy velocity.
You build it.
You build it.
Not a platform, a tool, or an agent: velocity is built into how your team works. That's why it compounds. And why the teams that have it keep pulling away.
The Velocity Curve
Five stages. One plateau almost everyone gets stuck on.
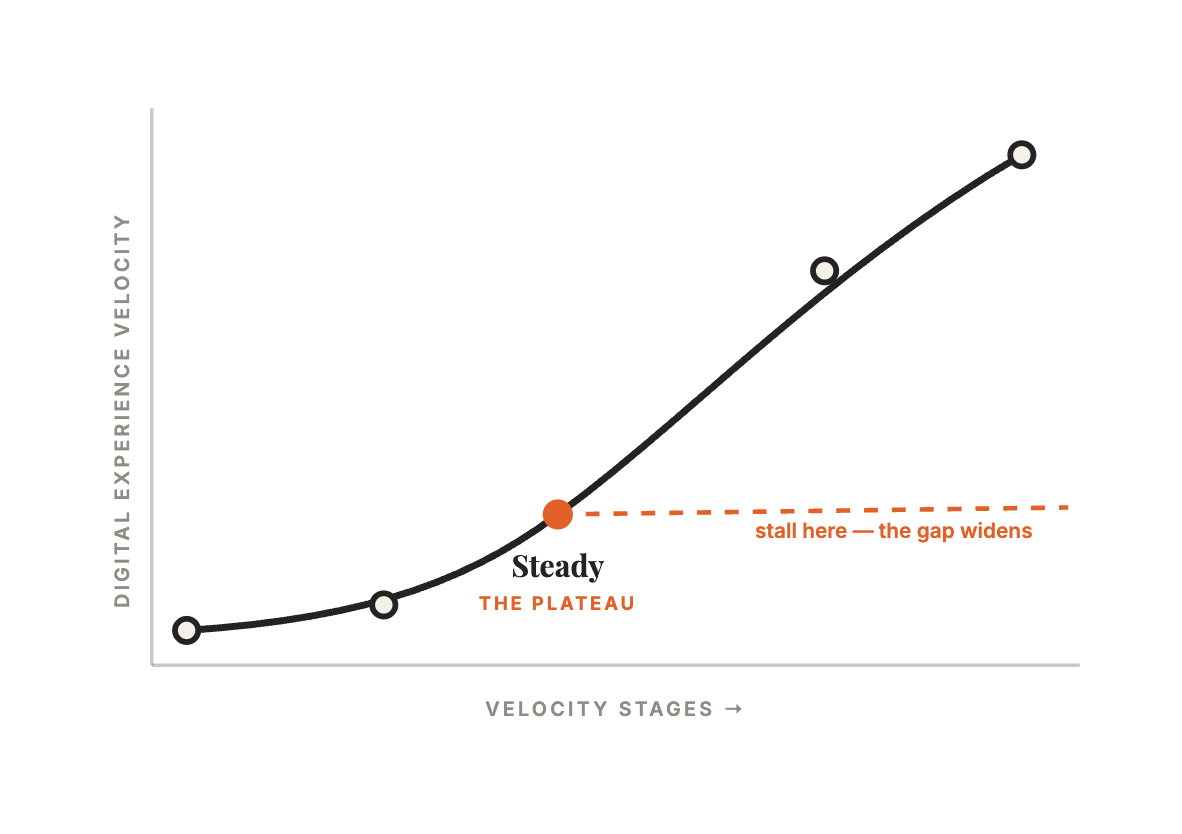
The dangerous stage isn't the bottom. It's the middle, where reliability feels like success while faster teams pull away.
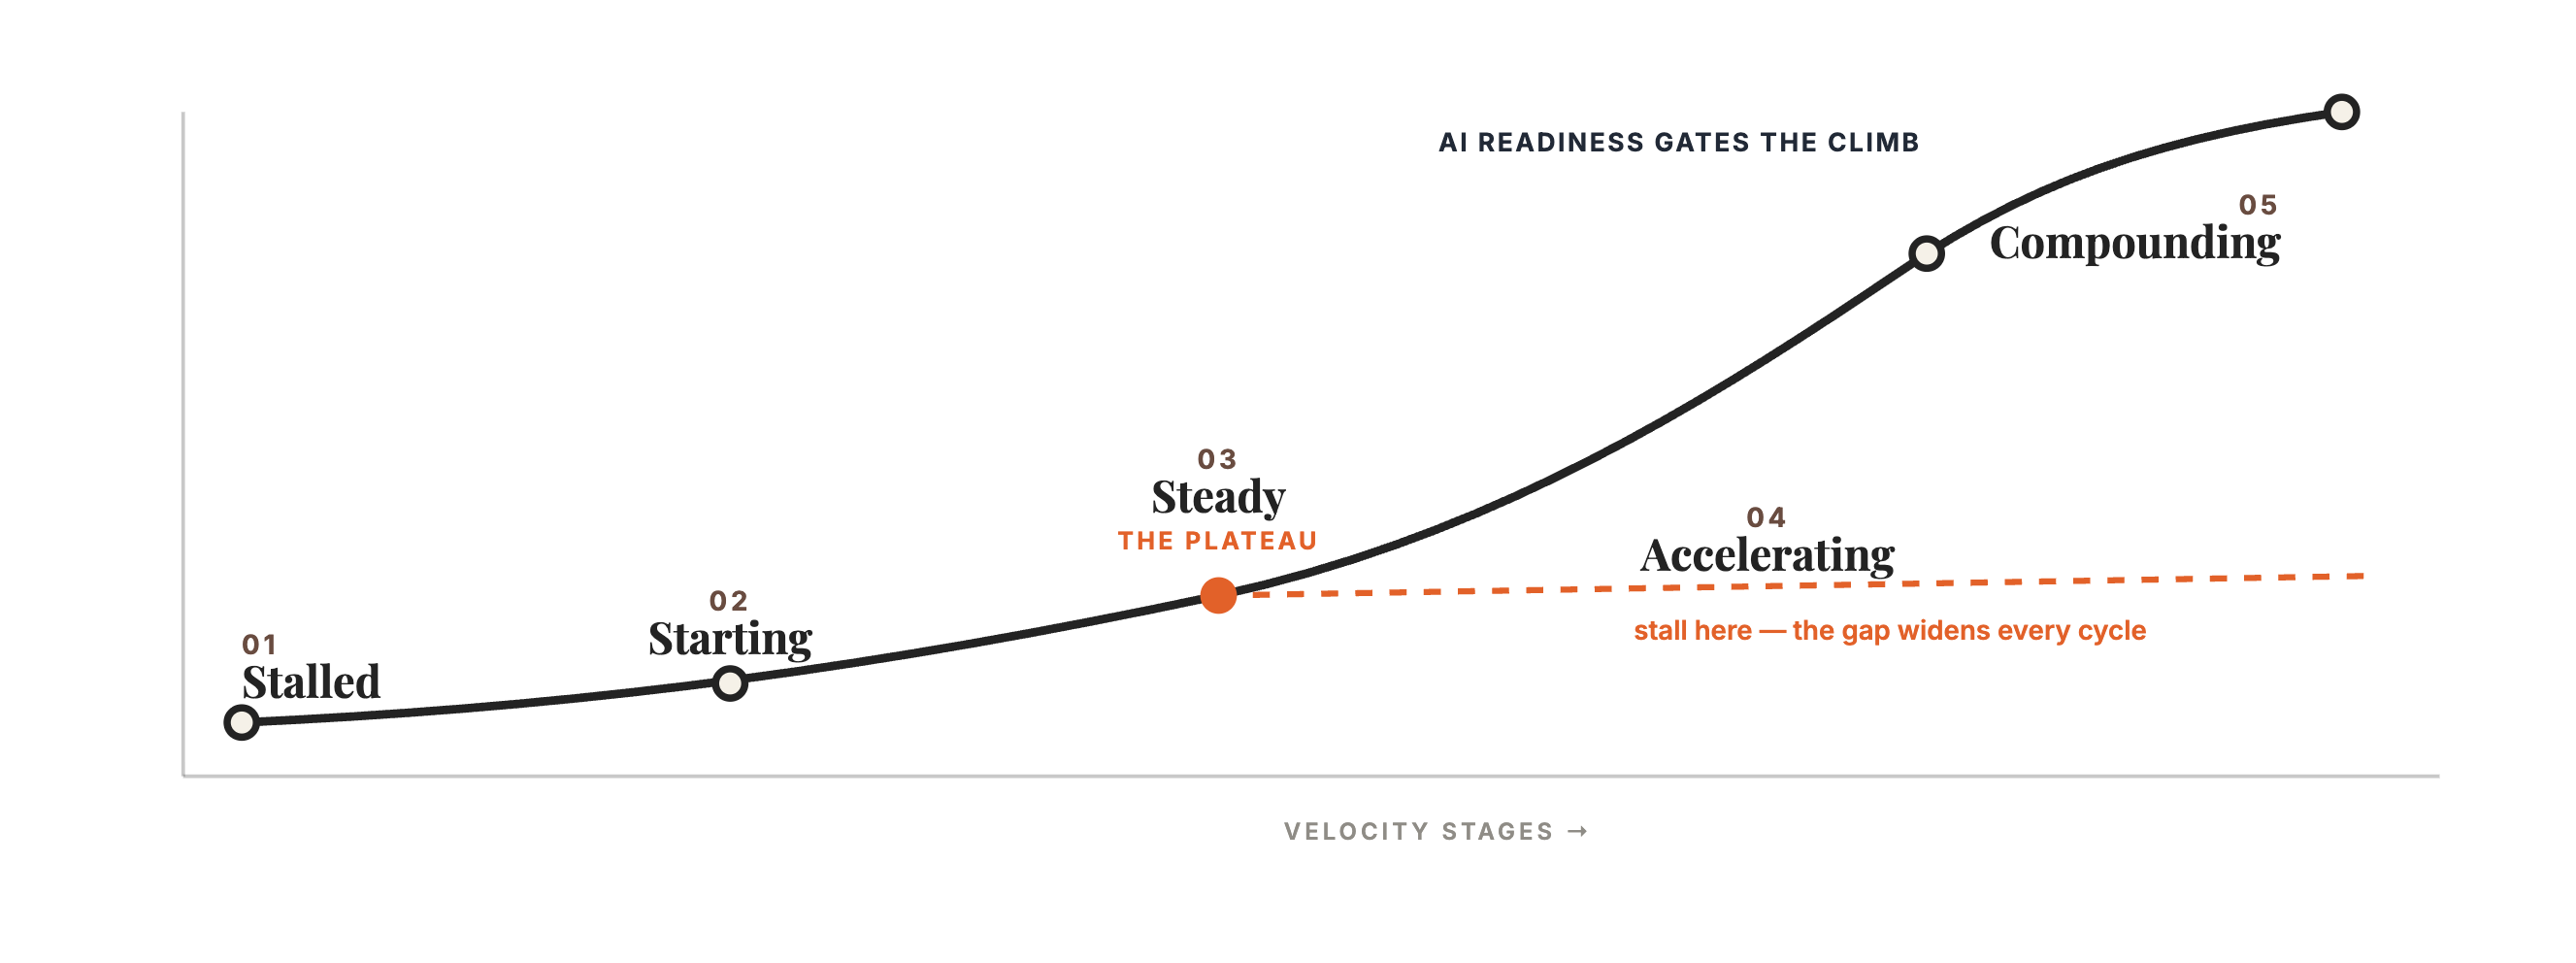
01
Stalled
Sequential and ticket-driven. Delivery survives on one heroic person.
02
Starting
A champion emerges; bottlenecks throttle output.
03
Steady
Reliable but capped. Marketing & IT still in series.
The Plateau
04
Accelerating
Parallel, automated, self-serve. AI augments under governance.
05
Compounding
Continuous and self-reinforcing. Cycle time compresses.
The model
Six dimensions place you on the curve.
Three layers of how your team works and one gate that isn't averaged in.
Organizational
Operational
Technical
Leadership & Digital Vision
Who owns digital, and is the roadmap tied to outcomes?
Operating Model & Workflow
How does work move: sequential and manual, or parallel and automated?
Platform & Technical Health
Is the platform modern and composable, or brittle and in debt?
Team Capability & Capacity
Does the team have the roles and the slack to build and sustain?
Content Operations
Is content structured and reusable, or rebuilt from scratch every time?
Measurement & Experimentation
Are decisions driven by data and testing, or by opinion?
Organizational
Leadership & Digital Vision
Who owns digital, and is the roadmap tied to outcomes?
Team Capability & Capacity
Does the team have the roles and the slack to build and sustain?
Operational
Operating Model & Workflow
How does work move — sequential and manual, or parallel and automated?
Content Operations
Is content structured and reusable, or rebuilt from scratch every time?
Technical
Platform & Technical Health
Is the platform modern and composable, or brittle and in debt?
Measurement & Experimentation
Are decisions driven by data and testing, or by opinion?
The cross-cutting gate
Governance, Risk & AI Readiness
Is your AI governed and ready, or only shadow-used? This is scored separately as your safe speed: it shows what you can adopt today, and what to build first so speed doesn't become risk.
The velocity advantage
What compounds for teams that build it.
They ship more and learn more.
Every release teaches, and every lesson makes the next release faster. Slow teams produce output; fast teams compound understanding.
They meet the bar as it moves.
Expectations reset continuously. High-velocity teams close the gap in weeks, not roadmap cycles.
They adopt AI early and safely.
AI multiplies whatever it lands on. High-velocity teams earn adoption while everyone else automates their bottlenecks.
They pull away.
The gap between fast and slow isn't fixed. It widens every quarter. Compounding advantages are the hardest kind to catch.
Proof
“We were transparent with C2: we wanted to build something together, but we didn't want to be tethered to an agency long-term. And that's where we got. We don't need that support as much anymore. I would recommend them to anyone.”
VP of Global Digital Marketing
Education · Personalization
Prince George's County Public Schools
A redesigned, personalized experience on Optimizely built to keep improving after launch.
E-commerce · Replatform
Chefs' Warehouse
A unified content and commerce experience: shipped, measured, and iterated.
Nonprofit publishing · Optimizely
Moody Publishers
A cohesive content-and-commerce experience on Optimizely built for a lean publishing team to run.
Where to start
The first step begins with clarity.
Step 01
Get your Velocity Score
Free · 5 minutes · self-guided
Scored 0–100 across six dimensions, placed on the curve, with your two weakest dimensions flagged and an honest read on your safe speed.
Step 02
Book your Velocity Assessment
Fixed scope · fixed fee · 3–4 weeks
The same six dimensions, expert-verified, ending in a leadership readout and a prioritized roadmap you own.
Where does the roadmap lead? For teams ready to climb, it runs through
VECTOR, our proactive managed services →Before you start
Fair questions, straight answers.
→
Is the Velocity Score actually free?
Yes — no payment, no obligation, no sales call required. It takes about five minutes, and your full readout is delivered by email.
→
How accurate is a five-minute self-assessment?
Honest enough to place you on the curve and show where your velocity is leaking — the questions are anchored to observable behaviors, not how things feel. But a self-report has blind spots: teams overrate the dimensions they understand best, and cross-functional gaps only show up when multiple people are in the conversation. The Velocity Assessment (paid) measures the same six dimensions, expert-verified. The Score tells you where to look; it doesn't claim to be the last word.
→
How is this different from other digital maturity models?
Three ways. Most maturity models describe states; the Velocity Model measures a rate — how fast your team turns intent into live experience — because the rate is what your market competes on. Most treat AI as the top level; ours treats AI readiness as a cross-cutting gate, scored separately, because adopting AI before you're ready isn't maturity — it's risk. And most end in a label; this one ends in action: a score, a verdict, and the specific constraint to fix next.
→
What happens after I get my Score?
Your readout arrives by email: your score and stage, your two weakest dimensions with the mechanism behind each, your safe speed, and a suggested next step. What you do with it is up to you — many teams share it internally and compare readouts across seats. There's no obligation and no follow-up call unless you ask for one.
→
Who is this for?
Marketing and digital teams of roughly 5–25 people — at credit unions, nonprofits, schools, government, and mid-market firms — running on Optimizely, Adobe, Sitecore, or any modern platform. If your team ships reliably but slowly, this was built for you.
→
Do we need to be on Optimizely?
No. The model measures how your team works, not which logo is on your stack. C2 works daily in Optimizely — we've been a partner for fifteen years — and the six dimensions apply to any modern platform. If the platform itself is what's capping your velocity, the model will tell you that, too.
Find you velocity.
Not a platform, a tool, or an agent: velocity is built into how your team works. That's why it compounds. And why the teams that have it keep pulling away.