
Digital Experience Velocity
Find your
velocity.
Velocity is the rate your team turns intent into live experience. It's the capability nearly every market now competes on — and most teams have no idea where theirs stands.
Signs of a velocity problem
Nothing is broken. And nothing moves.
A velocity problem doesn't look like a crisis. It looks like a competent team that ships reliably — eventually. If more than two of these sound like your week, you have one.
"A two-week change takes two months."
Every update queues behind tickets, approvals, and handoffs. The work isn't hard — the path is.
"Marketing waits on IT. IT waits on marketing.
The two teams work in series, not in parallel — and the seam between them is where your time-to-market goes to die.
"The relaunch spiked. Then it flatlined."
Your experience improves at launch and decays between launches — because improvement is an event, not a system.
"We track everything. We act on almost nothing."
The dashboards are full and the decisions still run on opinion. Data that doesn't change what ships isn't working.
"Everything runs through one person."
There's someone who knows how it all works — and every release, every fix, every idea bottlenecks on their calendar.
"AI is on the board agenda. Nobody can say if we're ready."
The pressure to adopt is real. So is the sense that your current operation isn't built to govern it.
These aren't six problems. They're one problem, showing up in six places — and it has a name.
Get your velocity scoreYou can't buy velocity.
You build it.
You build it.
Velocity is not a platform, a tool or an agent. It is built into how your team works: the leadership, the workflow, the data, the platform health, and the governance underneath every release. That's why it compounds. And it's why the teams that have it keep pulling away.
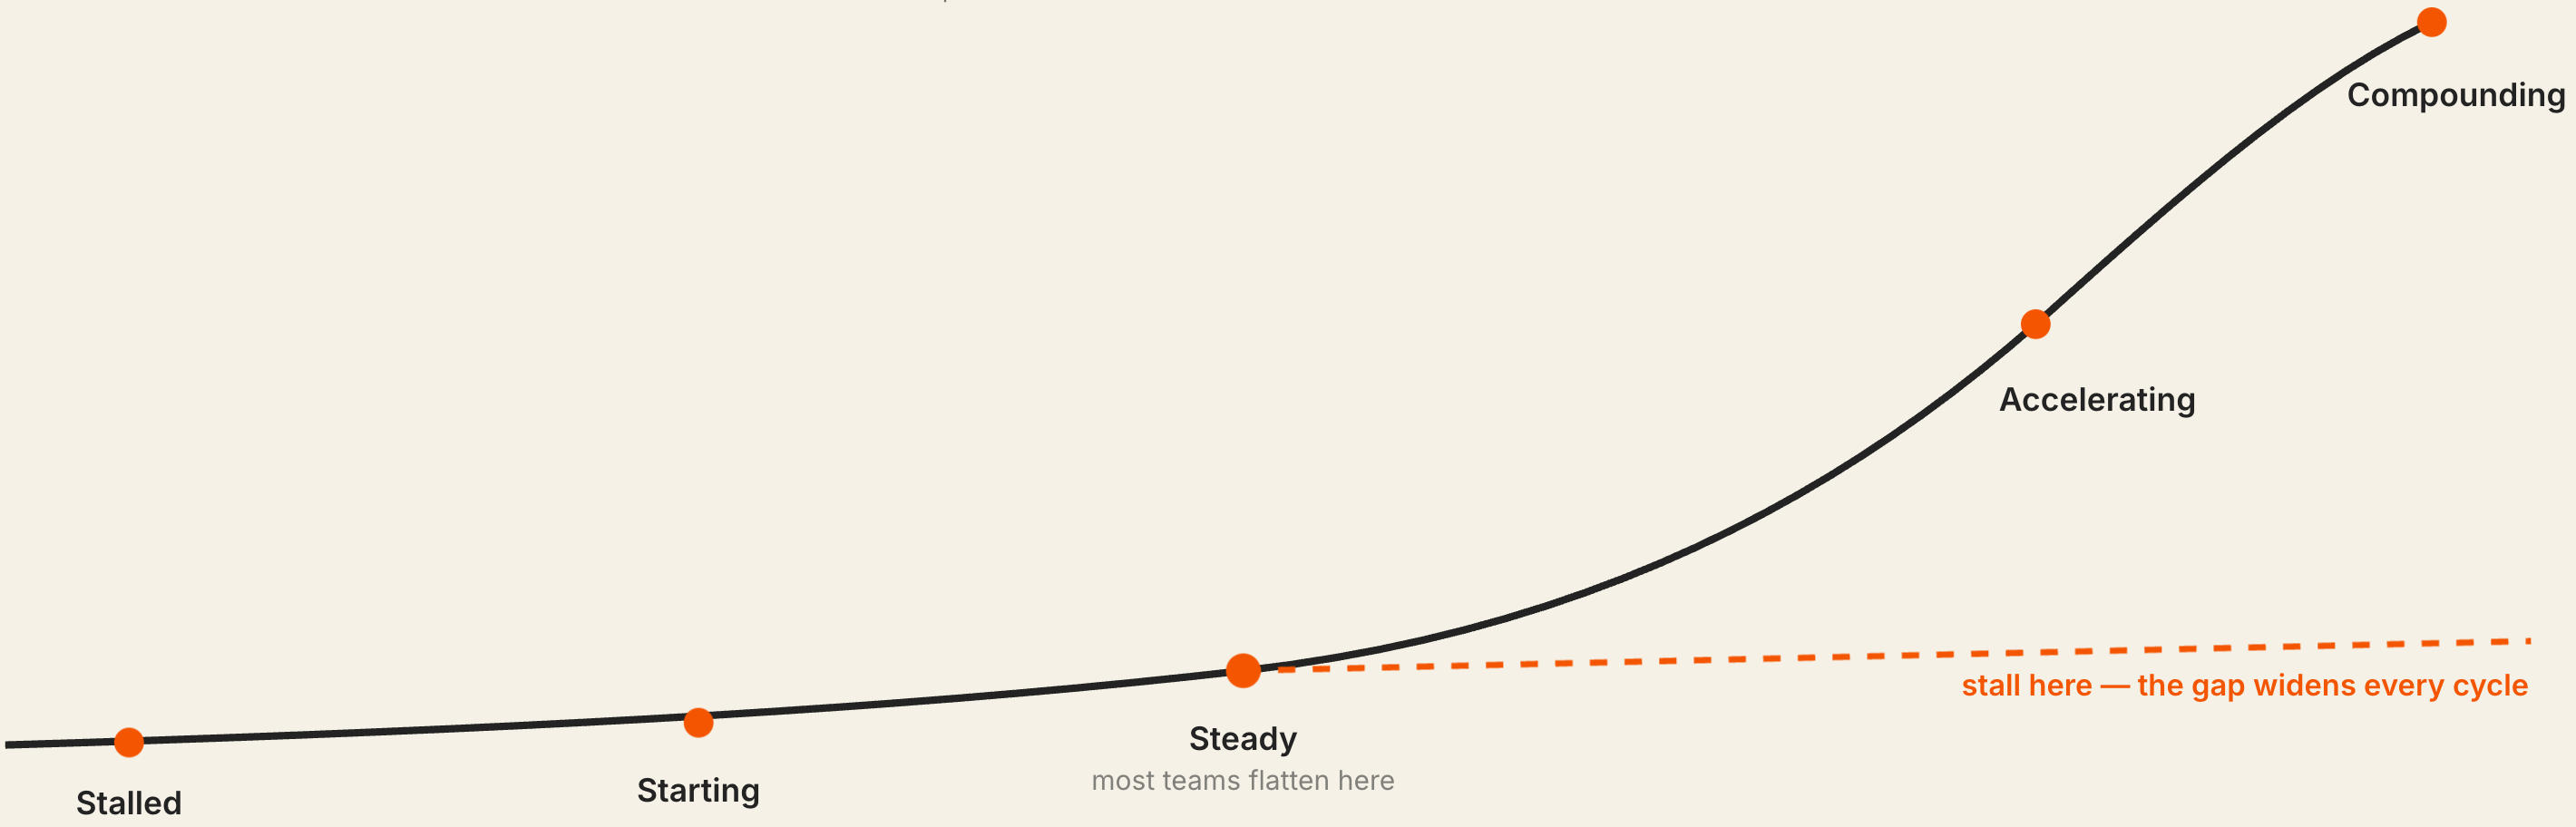
The Velocity Curve
Five stages. One plateau almost everyone gets stuck on.
Velocity reads as a trajectory, not a ladder. The dangerous stage isn't the bottom — it's the middle, where reliability feels like success while faster teams pull away every cycle.
01
Stalled
Sequential and ticket-driven. Marketing waits on IT. Delivery survives on one heroic person.
02
Starting
A champion emerges, but handoffs and bottlenecks throttle output. Data is tracked, not acted on.
03
Steady
Repeatable cadence, defined roles — reliable but capped. Marketing and IT still work in series.
04
Accelerating
Parallel work, automation, self-serve. AI augments the team — under governance, where it's earned.
05
Compounding
Continuous, self-reinforcing delivery. Reusable components compress cycle time. Governed, agentic adoption.
Where does your team sit on the curve?
Five minutes of questions. Three things you'll know at the end that you don't know now:
1
Your velocity score and stage
Scored 0–100 across six dimensions, placed on the curve, with a verdict in plain language — and what your results look like in your world.
2
Where your velocity is leaking
Your two weakest dimensions, flagged — with the mechanism behind each: why it's happening, what it's draining, and what it's costing you.
3
Your safe speed
An honest read on your governance and AI readiness — what you could safely adopt today, and what to build first so speed doesn't become risk.
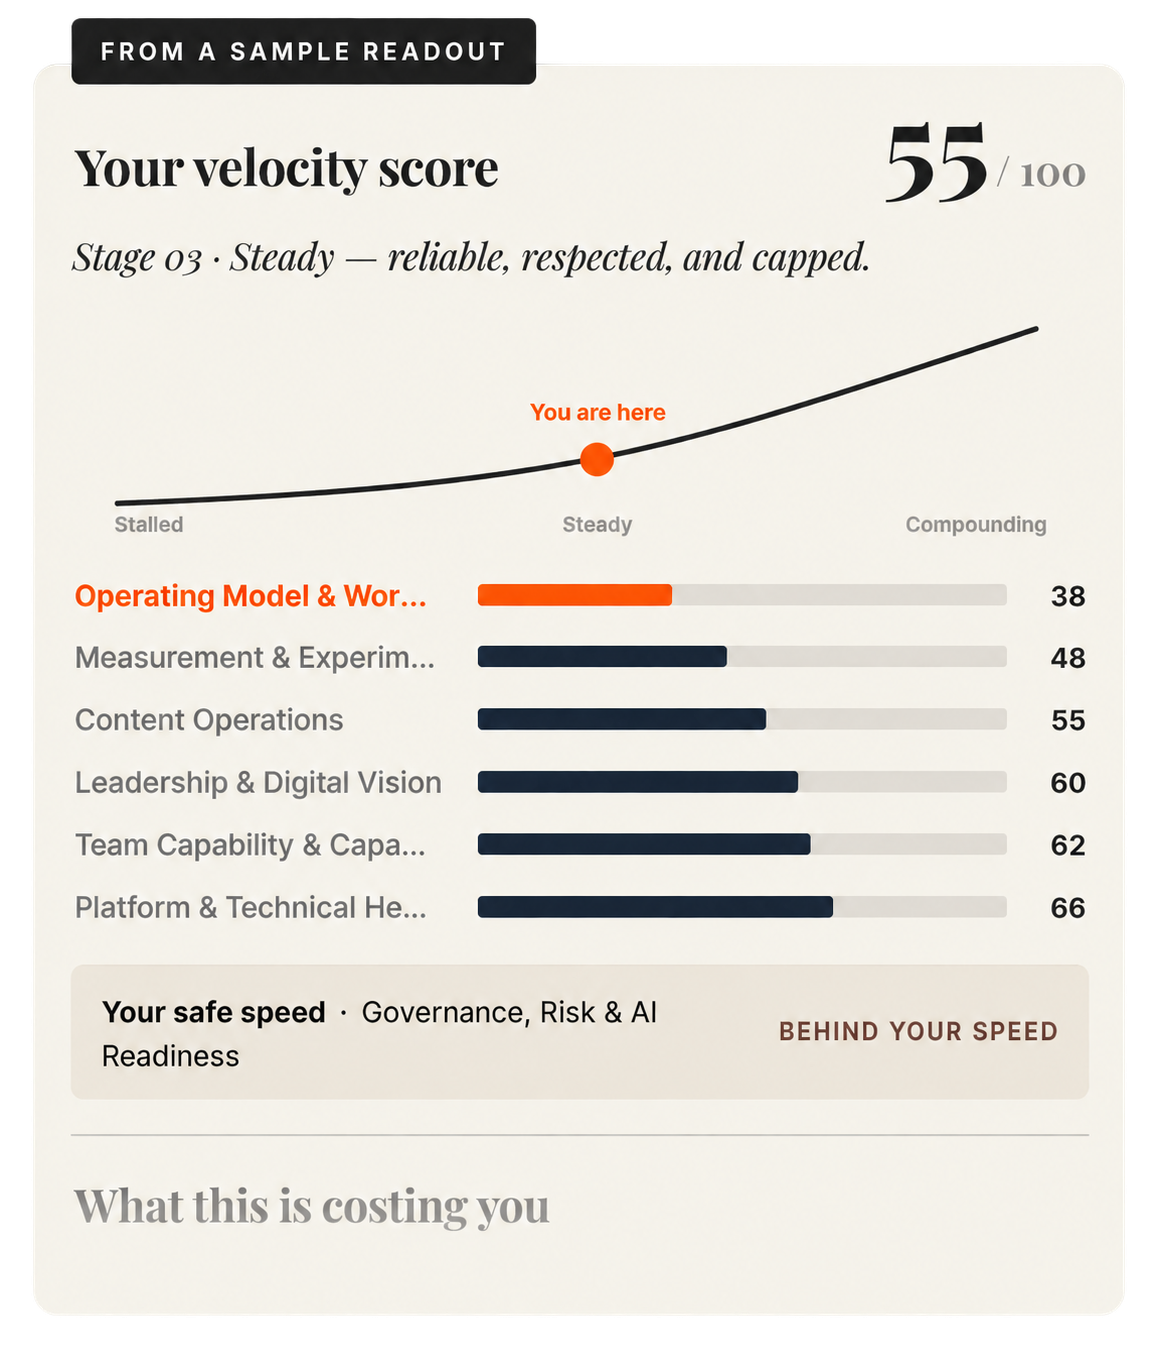
Inside the full readout: your stage verdict · what this looks like in your world · what it's costing you · the mechanism behind your two weakest dimensions · your safe speed · your next step.
Before you start
Fair questions, straight answers.
Is the Velocity Score actually free?
Yes — no payment, no obligation, no sales call required. It takes about five minutes. Your full readout is delivered by email, so we ask for your work email to send it.
What happens to my information?
Your readout goes to your inbox, and your results are visible to the C2 team so we can prepare if you ask for a follow-up conversation. We never publish, sell, or share individual results. If you'd rather we delete your results after sending the readout, reply to the email and we will.
How accurate is a five-minute self-assessment?
Honest enough to place you on the curve and show you where your velocity is leaking. The questions are anchored to specific, observable behaviors rather than how things feel. But a self-report has known blind spots: teams tend to overrate the dimensions they understand best, and the cross-functional gaps — especially the marketing-IT seam — only show up when multiple people are in the conversation. The Velocity Assessment (paid version) measures the same six dimensions on the same scale — the difference is that the Score is self-reported and the Assessment is expert-verified. The Score tells you where to look; it doesn't claim to be the last word.
Who is this for?
Marketing and digital teams of roughly 5–25 people — at credit unions, nonprofits, schools, government, and mid-market firms — running on Optimizely, Adobe, Sitecore, or any modern platform. If your team ships reliably but slowly, this was built for you.
Should my whole team take it?
Ideally, yes. Different seats often score the same organization differently — marketing sees one set of bottlenecks, technology sees another — and the disagreement is itself signal. Compare readouts; where your scores diverge is usually where the real constraint lives. And retake it every six months: the score should move.
Find your velocity
Five minutes from now, you'll know where your team sits on the curve — and what's holding it there.